Executive Snapshot
In one sentence Unsupervised learning analyzes data without predefined outcome labels to reveal natural groupings, unusual cases, hidden structures, and emerging patterns that may warrant professional attention.
| Question | Executive Answer |
|---|---|
| What does it do? | Finds patterns in data when the organization does not already know the “right answer.” |
| Where is it useful? | Claims segmentation, anomaly detection, fraud exploration, portfolio analysis, document organization, and emerging-risk discovery. |
| What is its greatest strength? | It can surface relationships and outliers that were not captured by existing rules or labels. |
| What is its greatest limitation? | A discovered pattern is not automatically meaningful, causal, fair, or actionable. |
| What does production use require? | Clear business purpose, governed data, validation, explainability, expert review, monitoring, and controlled workflow integration. |
| Does it make decisions? | No. It provides exploratory or decision-support signals; authorized professionals retain responsibility. |
Executive Summary
Unsupervised learning is a branch of machine learning that analyzes examples without being given a predefined target label. Instead of learning to predict a known outcome, the algorithm looks for structure within the data itself. It may identify clusters of similar claims, submissions, providers, attorneys, repair facilities, or policyholders; detect cases that differ sharply from normal patterns; or reduce thousands of variables into a smaller set of useful dimensions.
For Property and Casualty insurers, unsupervised learning is especially valuable when reliable outcome labels do not exist, when the organization wants to explore a large portfolio, or when emerging behavior may not resemble historical examples. It can help reveal new claim archetypes, unusual billing patterns, hidden concentrations of exposure, operational bottlenecks, and changing document or language patterns.
However, unsupervised learning does not determine whether a discovered cluster is good or bad, whether an anomaly is fraud, or whether a pattern should drive an insurance decision. Business meaning must be established through subject-matter review, source evidence, controlled investigation, and validation. The most responsible implementations treat unsupervised outputs as hypotheses or prioritization signals—not as automatic conclusions.
Quick Facts
| Dimension | What Leaders Should Know |
|---|---|
| Primary input | Structured data, text-derived features, images, networks, or combinations of these inputs. |
| Training target | No predefined outcome label is required. |
| Common methods | Clustering, anomaly detection, dimensionality reduction, topic modeling, association analysis, and representation learning. |
| Typical output | Groups, similarity scores, anomaly scores, latent dimensions, topics, or network communities. |
| Best insurance role | Exploration, segmentation, prioritization, emerging-pattern detection, and feature discovery. |
| Human role | Interpret patterns, validate evidence, determine materiality, authorize action, and monitor unintended effects. |
Definitions
Executive Definition
Unsupervised learning is a method for discovering useful patterns in insurance data when the organization has not already defined the outcome to predict. It helps leaders understand how cases naturally group together, which cases appear unusual, and what structures may be hidden across a portfolio.
Technical Definition
Unsupervised learning applies statistical or machine-learning algorithms to observations X without corresponding target labels y. The algorithm optimizes an objective based on similarity, density, reconstruction, compression, independence, or another structural property of the input distribution. The result may be a partition, embedding, anomaly score, latent representation, topic distribution, or learned relationship among observations.
Insurance Definition
In insurance, unsupervised learning examines policy, claim, payment, medical, document, behavioral, environmental, geospatial, and operational data to reveal segments, atypical activity, emerging risk patterns, or hidden relationships. The resulting signal supports professional investigation and portfolio understanding but does not, by itself, establish fraud, coverage, liability, causation, severity, or underwriting acceptability.
Insurance Definition
Critical distinction Supervised learning learns from known outcomes. Unsupervised learning searches for structure without a known outcome. The absence of labels creates discovery opportunities, but it also increases the need for interpretation and validation.
Why Unsupervised Learning Matters in P&C Insurance
- Insurance data often contains valuable signals that have never been formally labeled. A carrier may not have a reliable “emerging pattern” field, a consistently coded fraud outcome, or a complete taxonomy of claim complexity.
- New risks can appear before historical outcome data is mature. Changes in medical billing, attorney behavior, repair technology, weather patterns, litigation tactics, or cyber events may first emerge as unusual combinations rather than known labels.
- Large portfolios are difficult to understand through averages alone. Segmentation can expose materially different claim, account, provider, territory, or workflow populations that require different operating strategies.
- Unsupervised methods can complement supervised models by finding new features, identifying data-quality issues, revealing drift, and directing experts toward cases that deserve review.
The Core Unsupervised Learning Workflow
| Stage | What Happens | Insurance Control |
|---|---|---|
| 1. Define purpose | Specify the business question and how a discovered pattern could be used. | Document the intended use, prohibited use, owner, and review process. |
| 2. Assemble data | Select relevant data available at the analysis point. | Validate source, quality, lineage, permissions, and representativeness. |
| 3. Prepare representation | Scale variables, encode categories, derive text or image representations, and handle missing values. | Prevent sensitive or proxy variables from driving inappropriate segmentation. |
| 4. Select method | Choose clustering, anomaly detection, dimensionality reduction, or another technique. | Match the objective to the business question; avoid complexity without benefit. |
| 5. Evaluate structure | Assess stability, separation, density, reconstruction, or neighborhood quality. | Do not rely on one mathematical score; include expert review and source evidence. |
| 6. Interpret results | Describe clusters, outliers, or latent factors in business terms. | Require claims, underwriting, actuarial, legal, compliance, or SIU input as appropriate. |
| 7. Pilot in workflow | Present signals to professionals with explanations and supporting evidence. | Use prioritization or exploration first; preserve human authority. |
| 8. Monitor and refine | Track drift, false alerts, operational value, and unintended effects. | Govern thresholds, model changes, data changes, and retirement. |
Core Unsupervised Learning Methods
Clustering
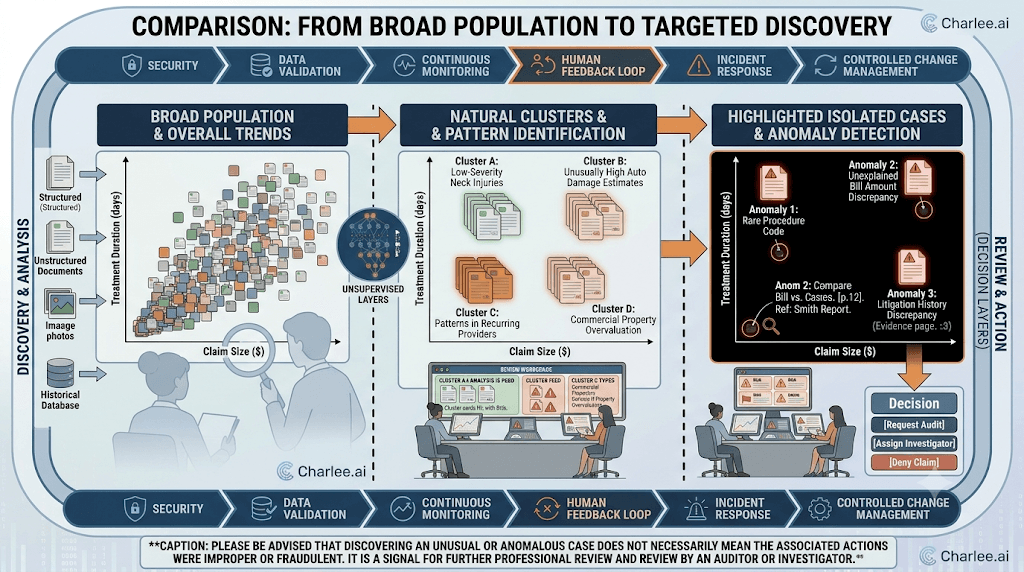
Clustering groups observations that are more similar to one another than to observations in other groups. In insurance, clusters may represent claim archetypes, account profiles, treatment pathways, provider behaviors, repair patterns, broker submission patterns, or workflow populations. The groups are created mathematically; professionals must determine whether they have operational meaning.
Anomaly Detection
Anomaly detection assigns a score based on how unusual an observation appears relative to expected behavior. It may identify a claim with an uncommon payment sequence, a provider with atypical billing combinations, a submission with inconsistent attributes, or a portfolio segment whose behavior has changed. An anomaly is a reason to review—not proof of misconduct or error.
Dimensionality Reduction
Dimensionality reduction compresses many variables into fewer latent dimensions while preserving important structure. It can support visualization, noise reduction, similarity search, feature engineering, and downstream modeling. Principal component analysis, autoencoders, and manifold-learning methods are common examples.
Topic Modeling and Semantic Grouping
Topic and semantic methods organize large collections of claim notes, medical reports, demand letters, applications, inspection reports, and other documents according to recurring themes or meaning. These methods can help identify emerging issues, document populations, or language changes that were not captured by existing categories.
Association and Network Analysis
Association analysis finds items or behaviors that frequently occur together. Network methods examine relationships among people, entities, providers, addresses, vehicles, policies, claims, devices, or transactions. Community detection can reveal connected populations that merit further review, subject to privacy, fairness, and investigative controls.
Association and Network Analysis
| Method | Typical Output | Illustrative Insurance Use |
|---|---|---|
| K-means / partition clustering | A defined number of groups | Segment claims or submissions into operational archetypes. |
| Hierarchical clustering | A tree of nested similarity | Explore broad and narrow portfolio groupings. |
| Density-based clustering | Dense groups plus noise points | Find irregularly shaped groups and isolated cases. |
| Isolation methods | Anomaly score | Prioritize unusual claims, payments, or accounts. |
| Autoencoders | Reconstruction error or latent representation | Detect unusual combinations in high-dimensional data. |
| PCA / latent factors | Reduced dimensions | Visualize and summarize correlated insurance variables. |
| Topic models / embeddings | Themes or semantic neighborhoods | Organize document collections and detect emerging language patterns. |
| Community detection | Connected groups | Explore entity relationships and coordinated activity. |
Association and Network Analysis
Interpretation warning Algorithms will usually find some pattern, even when the pattern is unstable, operationally irrelevant, or driven by data artifacts. Production value depends on validation, not on the mere existence of a cluster or anomaly score.
Insurance Applications Across the Value Chain
| Business Area | Application | Professional Use |
|---|---|---|
| Claims | Claim archetype discovery | Understand populations with different severity, duration, complexity, or service needs. |
| Claims | Anomalous payment or reserve activity | Direct adjusters, supervisors, audit, or SIU toward unusual patterns. |
| Claims | Provider and treatment-pattern analysis | Identify unusual combinations, durations, billing sequences, or referral networks. |
| Claims | Emerging litigation behavior | Detect changing attorney, venue, demand, or procedural patterns. |
| Underwriting | Risk segmentation | Reveal account groups with distinct exposure or loss characteristics. |
| Underwriting | Submission similarity | Locate comparable accounts or identify submissions that differ from expected appetite patterns. |
| Fraud / SIU | Network and anomaly exploration | Prioritize connected or unusual activity for authorized investigation. |
| Catastrophe | Event and damage-pattern clustering | Group losses by event, geography, cause, or damage characteristics. |
| Operations | Workflow segmentation | Identify teams, files, or processes with different handling and cycle-time patterns. |
| Data governance | Data-quality anomaly detection | Surface unexpected missingness, coding changes, duplicates, or source-system drift. |
Detailed Claims Scenario: Discovering Emerging Medical Escalation Patterns
A workers’ compensation carrier wants to understand why a subset of musculoskeletal claims is developing more slowly and at higher cost. The organization does not have a reliable label for “emerging medical escalation,” and existing reporting categories are too broad.
An unsupervised workflow combines structured claim data with document-derived information from medical reports, adjuster notes, treatment plans, pharmacy records, and utilization-review activity. The model creates clusters based on treatment sequence, provider mix, diagnostic language, referral timing, work-status changes, and claim-development patterns.
One cluster is materially different from the rest. These claims show repeated transitions between conservative treatment and specialist referral, increasing diagnostic intensity, delayed return-to-work planning, and a concentrated group of provider pathways. The model does not declare the claims excessive or inappropriate. It simply identifies a coherent population that differs from normal development.
Claims leaders and clinical professionals review representative files and source evidence. They confirm that the cluster reflects a meaningful escalation pattern and create an earlier nurse-review and return-to-work checkpoint. The organization pilots the intervention, tracks outcomes, and monitors whether the cluster remains stable over time. Human review converts the discovered pattern into a controlled operating response.
Detailed Underwriting Scenario: Portfolio Segmentation Beyond Traditional Industry Codes
A commercial insurer wants to improve portfolio understanding within a broad class of business. Traditional industry codes place materially different operations into the same category. The carrier applies clustering to exposure attributes, location characteristics, loss history, inspection findings, document-derived business descriptions, and operational features.
The analysis reveals several distinct account archetypes, including a group with similar industry codes but unusually high dependence on subcontractors, a group with concentrated equipment values, and a group with geographically dispersed operations. Underwriters and actuaries review the segments, compare experience, and determine whether additional questions, referral rules, or portfolio monitoring are justified.
The clusters do not set price or acceptability automatically. They provide a more precise lens for professional analysis and may become candidate features for later supervised modeling after definitions and outcomes mature.
Anomaly Detection: Powerful but Easy to Misuse
An anomaly score measures difference from an expected pattern. It does not explain why the case is different, whether the difference is material, or whether the case is adverse. A large property claim after a catastrophe may be statistically unusual but entirely legitimate. A new commercial risk may appear anomalous because the carrier has little comparable data. A provider may differ because of specialty, geography, or patient mix.
| Potential Cause of an Anomaly | What It Might Mean | Required Response |
|---|---|---|
| True emerging risk | A new or changing pattern not represented historically. | Investigate context, validate evidence, and consider controlled action. |
| Legitimate rare case | An uncommon but valid claim, account, or transaction. | Avoid adverse inference; document review outcome. |
| Data-quality problem | Missing, duplicated, delayed, or incorrectly coded information. | Correct the source issue and reassess the signal. |
| Process change | A new system, vendor, workflow, or coding practice. | Update baselines and monitor transition effects. |
| Potential fraud or abuse | Activity may warrant authorized review. | Treat as a lead only; follow SIU, legal, privacy, and evidence standards. |
| Model or representation weakness | The algorithm does not reflect relevant context. | Refine features, peer groups, thresholds, or method. |
Clustering Quality and Stability
Unlike supervised learning, there may be no single correct answer against which to score a cluster. Evaluation therefore combines mathematical measures, stability tests, interpretability, operational usefulness, and expert judgment.
- Internal validity: measures such as silhouette score, cohesion, separation, density, or reconstruction error.
- Stability: whether similar groups appear across resamples, time periods, parameter choices, and reasonable data changes.
- External validity: whether clusters differ on independent business measures not used to create them.
- Interpretability: whether professionals can describe the group using understandable characteristics and source evidence.
- Actionability: whether the group supports a legitimate workflow, investigation, service, or portfolio decision.
- Fairness and appropriateness: whether the segmentation creates unjustified differential treatment or relies on prohibited or proxy attributes.
Similarity Is Not Causation
Executive principle A cluster shows that observations are similar under the selected data and distance measure. It does not prove that the shared characteristics caused an outcome. Causal claims require additional design and evidence.
Data Preparation and Representation
Unsupervised methods are highly sensitive to how the data is represented. Variables with large numeric scales may dominate distance. High-cardinality categories may fragment the analysis. Missing values can become an unintended signal. Text embeddings may encode irrelevant or sensitive information. The representation must reflect the business purpose and be governed as carefully as the algorithm.
| Design Choice | Risk | Good Practice |
|---|---|---|
| Scaling | Large-value variables dominate similarity. | Normalize or standardize where appropriate and document the effect. |
| Distance metric | The chosen definition of similarity may not match the business problem. | Test alternatives and involve domain experts. |
| Missing values | Missingness may create artificial clusters. | Distinguish meaningful missingness from data-quality defects. |
| Text representations | Semantic vectors may capture unwanted associations. | Use source controls, evaluation, privacy review, and explainable evidence. |
| Mixed data types | Numeric, categorical, temporal, and text data behave differently. | Use suitable encodings or methods designed for mixed data. |
| Time | Patterns may reflect development stage rather than true differences. | Use time-aware cohorts, maturity controls, and monitoring. |
Business Benefits
- Earlier visibility into emerging patterns before reliable outcome labels exist.
- More precise portfolio segmentation than broad legacy categories alone.
- Prioritization of unusual cases for professional review.
- Discovery of data-quality defects and operational process changes.
- Identification of candidate features, labels, and hypotheses for supervised models.
- Improved document organization, similarity search, and knowledge discovery.
- Enhanced understanding of provider, attorney, repair, broker, territory, and workflow populations.
Risks and Governance
| Risk | Why It Matters | Control |
|---|---|---|
| False meaning | Humans may assign significance to arbitrary clusters. | Use stability testing, representative-file review, and independent challenge. |
| Anomaly equals wrongdoing | Unusual behavior may be legitimate. | Treat signals as leads; require evidence and authorized investigation. |
| Proxy discrimination | Clusters may reflect protected or sensitive characteristics indirectly. | Review features, subgroup effects, use purpose, and decision consequences. |
| Privacy and surveillance | Network or behavioral analysis can exceed reasonable use. | Apply legal basis, minimization, access control, retention, and purpose limitation. |
| Data drift | Normal behavior changes over time. | Monitor distributions, alert volumes, cluster composition, and business context. |
| Low explainability | Complex representations may be difficult to describe. | Provide nearest examples, defining characteristics, source evidence, and limitations. |
| Operational overload | Too many anomalies can overwhelm teams. | Set capacity-aware thresholds and measure review yield. |
| Uncontrolled reuse | Exploratory segments may be applied to decisions without validation. | Govern intended and prohibited uses; require approval before expansion. |
Human-in-the-Loop Operating Model
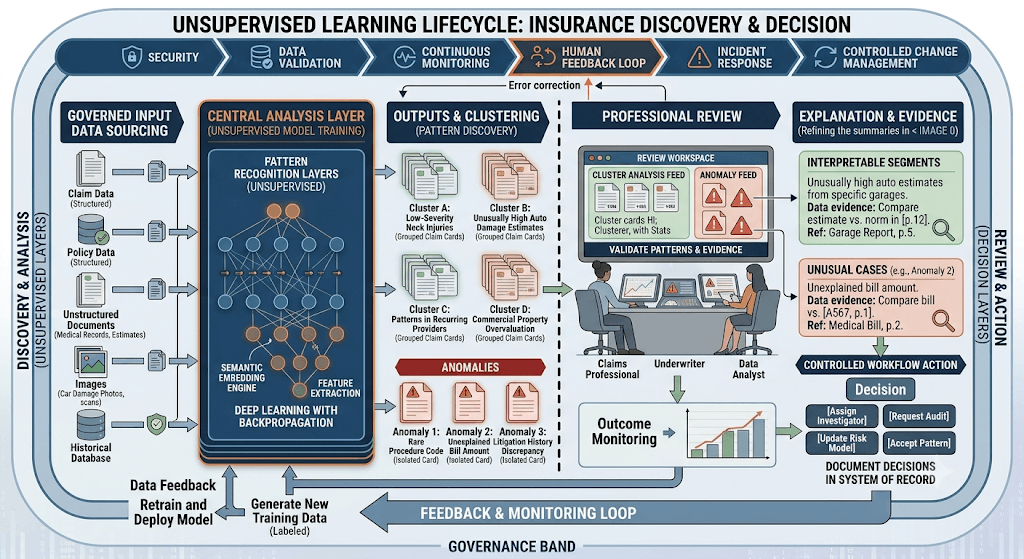
A responsible operating model separates detection from decision. The system identifies a cluster, similarity, or anomaly; a qualified professional reviews the explanation and underlying evidence; the professional determines whether the signal is relevant; and any material action follows established authority, policy, and documentation requirements.
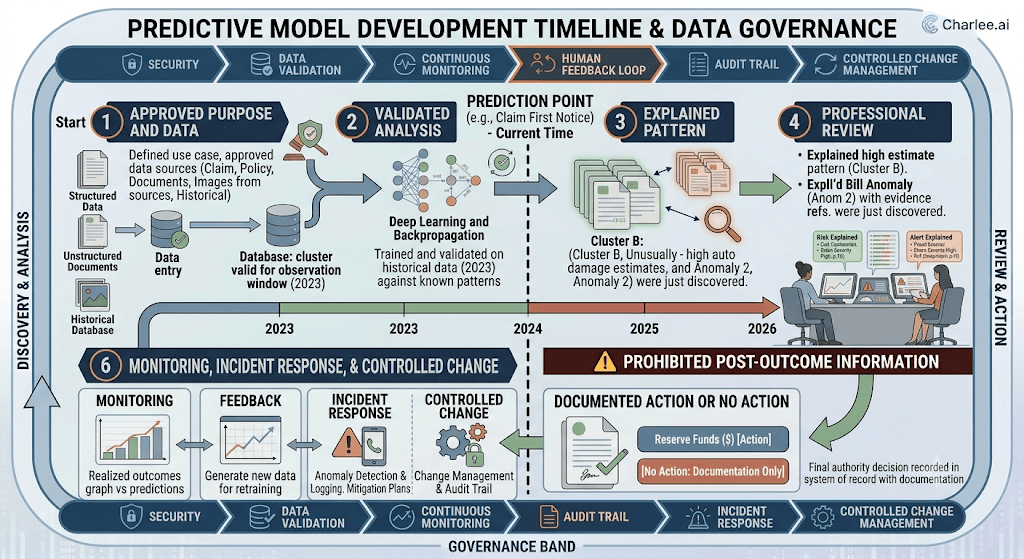
Standard governance loop Approved purpose and data → validated unsupervised analysis → explanation and source evidence → professional review → documented decision or investigation → monitoring, feedback, incident response, and controlled change.
Implementation Blueprint
| Phase | Key Activities | Exit Criteria |
|---|---|---|
| 1. Frame | Define question, users, action, prohibited uses, and success measures. | Approved use-case charter and accountable owner. |
| 2. Prepare | Validate data, representation, lineage, privacy, and security. | Documented dataset and quality assessment. |
| 3. Explore | Test simple baselines and candidate methods. | Reproducible analysis with initial stability evidence. |
| 4. Validate | Review representative cases, source evidence, subgroup effects, and alternatives. | Domain and independent validation approval. |
| 5. Pilot | Embed signals into a limited workflow with trained users. | Measured review yield, workload, usability, and business relevance. |
| 6. Govern | Establish monitoring, thresholds, access, incident response, and change control. | Production readiness approval. |
| 7. Scale | Expand only where evidence supports the same use and population. | Controlled rollout with continued monitoring. |
| 8. Retire or refresh | Respond to drift, low value, or changed purpose. | Documented replacement, retraining, or retirement. |
Best Practices
- Start with a business question, not an algorithm looking for a use case.
- Use transparent baselines before selecting more complex methods.
- Define similarity in terms that reflect the insurance problem.
- Review representative members, edge cases, and nearest neighbors—not only cluster averages.
- Test stability across time, samples, parameter choices, and reasonable data changes.
- Provide source evidence and understandable descriptions to professional users.
- Separate exploratory analysis from production decision support.
- Treat anomaly signals as hypotheses and document investigative outcomes.
- Monitor alert volume, review yield, drift, subgroup effects, and business value.
- Control reuse of segments, embeddings, and anomaly scores across new purposes.
Common Mistakes to Avoid
- Assuming every cluster represents a real business segment.
- Naming a cluster in a way that overstates what the data proves.
- Treating an anomaly as evidence of fraud, abuse, or error.
- Using arbitrary numbers of clusters without stability or business validation.
- Ignoring scaling, missingness, distance metrics, time, and data maturity.
- Allowing sensitive or proxy characteristics to drive differential treatment.
- Launching an alert without capacity-aware thresholds or a review workflow.
- Reusing an exploratory model for pricing, claims, or underwriting decisions without new validation.
- Failing to monitor changes in data sources, normal behavior, and cluster composition.
- Choosing a complex method when a simple segmentation or visualization would suffice.
Success Measures
| Measurement Area | Examples |
|---|---|
| Technical quality | Stability, cohesion, separation, reconstruction quality, neighborhood consistency, drift. |
| Review quality | Percentage of signals judged meaningful, duplicate rate, false-alert burden, reviewer agreement. |
| Operational value | Cycle-time improvement, prioritization efficiency, audit yield, investigative yield, workload fit. |
| Business value | Earlier intervention, reduced leakage, improved portfolio understanding, better service or resource allocation. |
| Governance | Documented approvals, incidents, overrides, subgroup review, access compliance, controlled changes. |
| Adoption | User engagement, explanation usefulness, feedback quality, workflow completion. |
Executive Decision Guide
Questions to Ask Before Approving a Use Case
- What hidden structure, unusual behavior, or emerging pattern are we trying to understand?
- Why is an unsupervised method appropriate instead of rules, reporting, or supervised learning?
- What action can a qualified professional take after reviewing the result?
- How is similarity or abnormality defined, and does that definition match the business purpose?
- How will clusters or anomalies be validated for stability, meaning, fairness, and usefulness?
- What source evidence will users see?
- Could the analysis create unjustified adverse treatment or investigative bias?
- Who owns the data, model, workflow, review, escalation, and final decision?
- How will thresholds, alert volume, drift, incidents, and model changes be governed?
- What uses are explicitly prohibited without additional approval and validation?
Vendor Evaluation Questions
- How does the solution explain why a case is grouped or considered anomalous?
- Can users inspect source documents, data elements, similar cases, and defining characteristics?
- How are peer groups, distance measures, thresholds, and representations selected and governed?
- How is stability tested across time, lines of business, jurisdictions, and portfolio changes?
- How are sensitive attributes and proxies handled?
- How does the platform prevent anomaly scores from being treated as automatic fraud or underwriting decisions?
- What monitoring exists for data drift, alert volume, cluster drift, and operational value?
- How are changes versioned, validated, approved, and rolled back?
- Can the solution integrate with existing claim, policy, document, and case-management workflows?
- What evidence demonstrates business value in comparable P&C use cases?
Charlee.ai Perspective
Unsupervised learning can help insurers see patterns that conventional reports and predefined rules miss, especially across large volumes of structured and unstructured claim information. Its value is strongest when document intelligence converts medical reports, demand packages, police reports, adjuster notes, and other records into governed, traceable information that can be analyzed alongside core claim data.
Charlee.ai’s people-plus-AI philosophy places the professional at the center. A cluster, similarity score, or anomaly should be timely, explainable, connected to source evidence, and presented within the workflow where a claims professional, underwriter, supervisor, clinician, auditor, or investigator can evaluate it. The purpose is not to label people or claims automatically. It is to help professionals recognize emerging patterns, prioritize attention, and make better-informed decisions with appropriate governance.
Key Takeaways
- Unsupervised learning discovers structure without requiring predefined outcome labels.
- Its core insurance uses include clustering, anomaly detection, dimensionality reduction, semantic grouping, and network discovery.
- A cluster is not automatically a valid business segment, and an anomaly is not proof of fraud or error.
- Representation choices, similarity measures, missingness, time, and data quality strongly influence results.
- Validation must combine technical measures, stability testing, source-evidence review, expert judgment, fairness, and operational usefulness.
- Outputs should support exploration and prioritization within a human-in-the-loop workflow.
- Governance should define intended use, prohibited use, access, thresholds, monitoring, incidents, change control, and accountability.
- The greatest value comes from turning previously hidden patterns into earlier, better-informed professional action.
In one sentence Unsupervised learning analyzes data without predefined outcome labels to reveal natural groupings, unusual cases, hidden structures, and emerging patterns that may warrant professional attention.
Frequently Asked Questions
No. Unsupervised learning is one major type of machine learning. Machine learning also includes supervised, semi-supervised, self-supervised, reinforcement, and other approaches.
The training data does not include a predefined target label. The method searches for structure based on the input data and its mathematical objective.
A cluster is a group of observations that are more similar to one another than to other observations under the selected representation and similarity measure.
An anomaly is an observation that appears unusual relative to an expected pattern or peer group. It is not automatically fraud, error, or adverse risk.
It can identify unusual or connected activity that may deserve review, but it cannot establish fraud by itself. Authorized investigators must assess evidence and context.
There is no universal number. The choice should reflect stability, interpretability, business usefulness, method characteristics, and the intended workflow.
Evaluation combines mathematical quality, stability, independent business measures, representative-case review, interpretability, fairness, and operational usefulness.
Yes. NLP, embeddings, and document intelligence can represent medical reports, demand letters, claim notes, applications, and other text for semantic grouping or anomaly analysis.
Usually not. It is commonly a relative measure of unusualness and should not be interpreted as the probability of fraud, severity, or another outcome unless specifically calibrated and validated for that purpose.
It compresses many variables into fewer dimensions while preserving useful structure. It supports visualization, denoising, similarity, and downstream modeling.
Only after the intended use, validation, fairness, explanation, authority, and governance are appropriate. Exploratory clusters should not be silently converted into adverse decisions.
Results can be driven by representation choices, scaling, missingness, distance metrics, or data artifacts rather than meaningful business structure.
Users may overinterpret a cluster or anomaly, creating unnecessary work or unjustified conclusions.
Refresh should be governed by data change, drift, business change, performance, and use-case need—not by an arbitrary schedule alone.
Yes. It can create features, reveal segments, identify data issues, suggest labels, and expose populations that may require separate models or evaluation.
Measure whether the analysis improves prioritization, discovery, review yield, portfolio understanding, cycle time, intervention, or another defined business outcome.
No. It supports exploration and prioritization. Qualified professionals interpret evidence and remain responsible for material decisions.
A defined purpose and action, governed data, suitable representation, stability testing, expert interpretation, explainability, fairness review, workflow integration, monitoring, security, change control, and accountable human decision-making.